
Price-to-sales ratio (P/S ratio or PSR), also known as the sales multiple or the revenue multiple, is a valuation ratio that measures the price an investor is willing to pay for a company’s stock relative to its revenue. In other words, it is what the market perceives to be the per dollar value of a company’s revenue.
The P/S ratio is especially useful for valuing start-ups and other newly formed companies with high growth potential but that have not delivered significant profits till now. It is also an effective tool for measuring companies in cyclical industries or those with temporary negative earnings, but showing signs of revival.
Generally speaking, all things considered equal, a lower price to sales ratio is considered favorable as it indicates undervaluation. More specifically, if the ratio is less than one, it is considered good and anything above 4 is a warning sign that the company is overvalued.
Price to Sales Ratio Formula

The most common way to calculate the price-to-sales ratio is by breaking down the market capitalization and sales into a per-share basis.
You can arrive at sales per share by dividing the company’s total sales over a designated period by the average number of outstanding shares of the company. The average number of outstanding shares refers to the average of the opening and closing number of outstanding shares of a company over the designated period.
And the market price, of course, can be taken from any of the finance or stock exchange websites.
You can also calculate P/S ratio with the below formula:

Market Capitalization refers to the total market dollar value of all the outstanding shares of the company. We can arrive at this figure by multiplying the current market price of the company’s share with the total number of outstanding shares of the company as on that date.
You can look for the total number of shares outstanding in the company’s income statement or in the notes to account in the annual report. The current market price of the share is available on major finance websites such as Google or Yahoo finance or on stock exchange websites such as NASDAQ or S&P 500.
Total Sales in the above formula refers to the total sales of the company over a designated period. This period can be either the previous financial year or calendar year or sometimes even the forecasted sales for the next financial year. But the most commonly used indicator is total sales over the past 12 months, commonly referred to as Trailing Twelve Months (TTM), and can be found in the income statement of the company.
Price to Sales Ratio Example
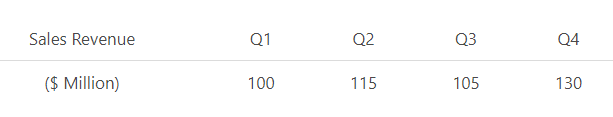
Company A has posted its quarterly sales figures for the Financial Year 2019 as follows:
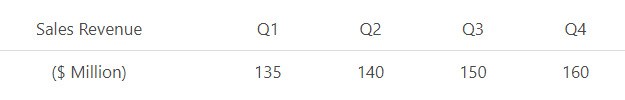
It has also posted its quarterly forecasted sales for financial year 2020 as below:
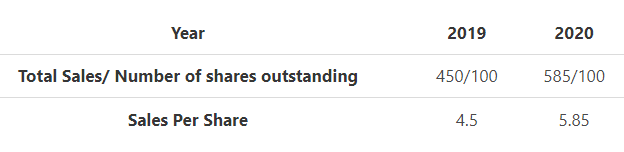
The company has 100 million shares outstanding as on Dec 31, 2019. The company’s shares are currently trading at $5 per share. What would be its P/S ratio for the years 2019 and 2020?
In order to calculate the PSR, we will have to:
- Calculate the total sales for each of the years
- Calculate the sales per share for each year
- Calculate PSR for each year
Let’s first calculate the total sales for each of the years. The total sales for each of the years would be:
- FY 2019 = 100+115+105+130
- FY 2019 = 450
- FY 2020 = 135+140+150+160
- FY 2020 =585
Now we can calculate the sales per share for each of the years:
At this point, we have all of the information we need to use the price-to-sales formula to calculate the ratio:


As we can see from the above example, the P/S ratio of Company A is forecasted to improve greatly from 1.11 to 0.854. The reason could be the projected sales growth of 30% in the year 2020.
To find out if Company A’s stock is overvalued or undervalued, we need to compare it with the industry’s P/S ratio. Say, the industry’s P/S ratio is 1, then it can be concluded that Company A’s stock is trading at a premium valuation in 2019 but is expected to see a fall in valuation in the year 2020.
Price to Sales Ratio Analysis
The Price to Sales Ratio works by measuring the company’s market value against its revenues. For instance, if an investor wants to decide on whether to buy shares in a start-up that is yet to turn profitable, he can look at the P/S ratio to decide whether the company’s stock is overvalued or undervalued. He can do this by comparing the P/S ratio of the company with that of companies in the same industry. If the industry’s P/S ratio is higher than that of the start-up’s, then it might be worth investing in the share.
P/S ratio is also quite a valuable tool in situations where the use of Price Earnings ratio (P/E ratio) might not be quite advantageous. For instance, in an industry like FMCG (Fast Moving Consumer Goods), the P/E ratio of most companies is quite high. In such cases, if investors look just at the P/E ratio as an indicator of valuation that would not provide the real picture. In such cases, PSR could be a good measure to see whether a particular FMCG stock is overvalued or undervalued based on its revenues.
PSR can also be useful in detecting turnaround situations. Say, a company has suffered a temporary setback and has not generated profits due to which share prices are at an all-time low, a shrewd investor can use the company’s revenue as an indicator to measure its growth, instead of its earnings.
Although quite intuitive, PSR comes with its own set of limitations.
PSR is not useful to compare companies across industries. Sales turnover might not be a fair indicator for companies in certain sectors such as technology and service where the per dollar revenue is much higher than what you might see in say, FMCG or construction companies.
The other more important issue is with the P/S ratio itself. The ratio ignores two important financial health indicators – debt and profitability.
As much as turnover is an important financial health indicator, a company’s ultimate goal is to generate profits. If a company keeps growing aggressively without generating profits over a sustained period, then it is essentially destroying investor wealth. PSR completely ignores this factor.
A company’s debt is an important factor that needs to be considered while valuing a stock. For instance, if you are comparing two companies (one leveraged and the other unleveraged) with the same P/S ratio, then the unleveraged one is the more attractive option. This is so because a leveraged company might need to generate higher sales than an unleveraged company to service its debt.
Due to its limitations, one can conclude that the investment decision should not be based on just this one metric. A savvy investor should always use a wide range of relevant financial and valuation ratios and metrics to value a company’s stock price.
Conclusion
To sum up,
- PSR measures the relative valuation of a company against its revenues
- The two indicators for measuring PSR are market capitalization and sales revenue
- PSR is quite useful for evaluating companies in cyclical industries or high growth companies with limited or no profitability such as start-ups, as well as to detect companies that are in a turnaround mode.
- PSR does not take into account profitability and debt and that could give a distorted view of the financial health of the company.
- PSR needs to be used in consonance with other profitability and valuation ratios to correctly ascertain the financial health of a company
Price to Sales Ratio Calculator
FAQs
What is the price to sales (P/S) ratio?
The price to sales (P/S) ratio, also known as the sales multiple or the revenue multiple, is a valuation ratio that measures the price an investor is willing to pay for a company’s stock relative to its revenue. In other words, it is what the market perceives to be the per dollar value of a company’s revenue.
How do you calculate price to sales ratio?
The most common way to calculate the price-to-sales ratio is by breaking down the market capitalization and sales into a per-share basis.
The formula for price to sales ratio is:
P/S Ratio = Market Value per Share / Sales per Share
What is a good price to sales ratio?
The price to sales ratio is mainly used to compare companies across industries. A high P/S ratio could be indicative of a stock being overvalued, while a low P/S ratio might suggest that the stock is undervalued.
There is no definitive answer as to what constitutes a good or bad P/S ratio as it varies from industry to industry. However, analysts generally agree that a P/S ratios between one and two are generally considered good while a P/S ratio of less than one is considered excellent.
What does a high price to sales ratio mean?
A high price to sales ratio means that the stock is overvalued and that investors are paying more than the company is worth relative to its revenue. This could be a sign that the stock might be due to drop in value in the future.
What does price to sales ratio tell you?
The price to sales ratio is mainly used to compare companies across industries. It can be used to determine whether a stock is overvalued or undervalued. Additionally, it can provide insights into the health of a company by comparing it against its peers.