
The supply schedule is a graph showing how many products are demanded from customers at a specific price based on the supply curve. The graph will depict the price on the left vertical axis of the chart, and the quantity of the supply will be on the horizontal axis.
The supply schedule is the table that shows the relationship between price and quantity, and the supply curve is the graphical representation of the supply schedule.

What Does Supply Schedule Mean?
Businesses make use of the supply schedule to understand how many products were sold at what price. The supply curve can show if an increase in your price will increase the company’s willingness to produce a product. Management can use this schedule to determine at what price they need to sell their products and how many products they need to provide.
Factors that influence the number of products that a company supply includes:
- Political conditions
- Production costs
- Price of a substitute product
- Complementary products
How a Supply Schedule Works
If everything is kept equal and the price of a product increases, then the quantity that is supplied to that product will increase. This will indicate a supply curve that will move upward from left to right.
You will need to draw a new supply curve if anything besides the price or the quantity of the product changes. Let’s take the example where new pumpkin farmers enter a market, and this increases the number of products that can be supplied in the market. A new supply curve will be added that has shifted to the right. Technology is one of the leading causes of shifts in the supply curve.

The reverse of this can also happen where the supply curve can shift to the left. This occurs when there is a change in the price of the production of a product.
Uses of the Supply Curve
The supply curve can be used to supply the consumer surplus. The consumer surplus is the difference between the price of the product that the customer is willing to pay and the amount that the customer pays for the product.
The supply curve is used by economists, governments, and manufacturers to understand the behavior of customers in a market. It helps to analyze how well the economy is performing or how they can make changes to a market to boost the economy.
Producers and manufacturers use the supply curve to understand what products are required in the market and what price they need to charge. Producers will not be willing to supply products if they cannot get the right price for their products
Other economic concepts that can be understood with a supply curve are price ceilings, price floors, consumer and producer surplus, market equilibrium, and market structures.
Supply Schedule Examples
Example 1
Sandy makes handbags and sell them from her house. She sells 50 bags for the price of $10 per bag, it costs her $2 to make a handbag. Leaving her a profit of $5 per bag. She found out from Clara that owns a handmade jewelry business that she can be more profitable selling jewelry.
Clara earns $20 when she sells 100 pieces of jewelry. She receives a profit of $10 per piece of jewelry. Sandy thinks this will be more profitable than her $2 per product. Sandy decided to make jewelry, and she can make 100 pieces. She believes that her customers will be willing to pay $25 for the 100 pieces of jewelry. Sandy would like to produce 125 pieces of jewelry, but she is constrained by the number of hours that she must provide the jewelry. If she wants to increase the number of products that she can make, she will have to hire someone else to assist her with the work.
In moving over to the new jewelry market, Sandy will shift the supply curve to the right, and a new supply curve will be added. There will be more products available on the market.
Example 2
Below is a supply schedule for a product with different quantities and prices per quantity.
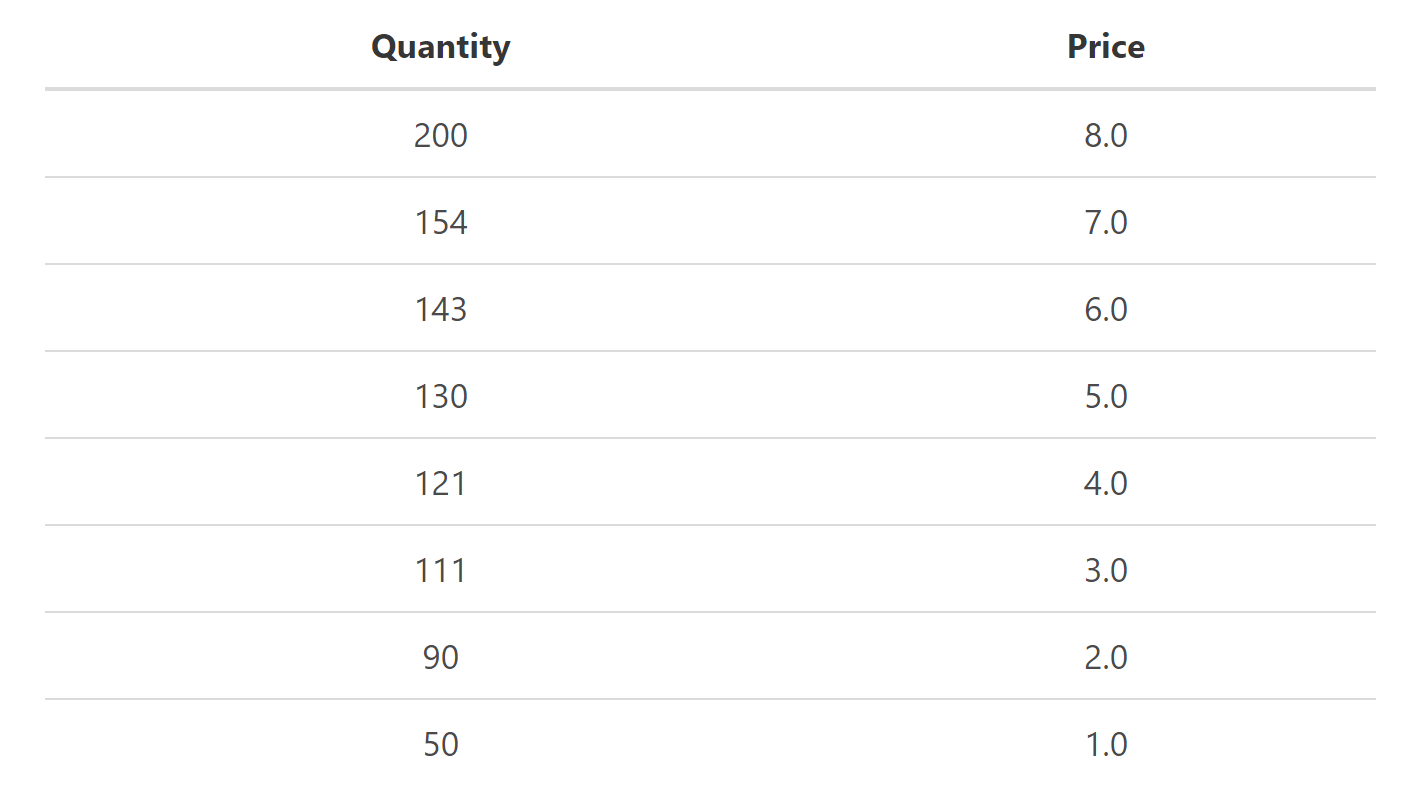
There is a direct relationship between the price and the quantity that the supplier is willing to supply. These points can be plotted on a Cartesian coordinate system, and a trend line can be drawn through the points.

The supply will always be in the first quadrant in a Cartesian coordinate system because the price and the quantity of the product can never be negative numbers. You will find that the supply curve typically intercepts the vertical axis at some point above zero because suppliers will not produce products that are priced below the production costs.
Supply Schedule Conclusion
- The supply schedule is a graph that shows you how many products are demanded from customers at a specific price based on the supply curve.
- The supply curve can show if an increase in your price will increase the company’s willingness to produce a product.
- Factors that influence the number of products that a company supply includes:
- Political conditions
- Production costs
- Price of a substitute product
- Complementary products
- Uses of the supply curve
- The supply curve can be used to supply the consumer surplus
- The supply curve is used by economists, governments, and manufacturers to understand the behavior of customers in a market
- Producers and manufacturers use the supply curve to understand what products are required in the market and what price they need to charge.
FAQs
1. What is a supply schedule?
A supply schedule is a graph that shows you how many products are demanded from customers at a specific price based on the supply curve. The graph depicts the relationship between the price of a product and the quantity that is supplied by the producers in the market.
2. Why is the supply schedule important?
The supply schedule is important because it allows producers and manufacturers to understand the behavior of customers in a market. The curve can be used to supply the consumer surplus, and it can be used by economists, governments, and manufacturers to understand the needs of the customers.
3. What are the types of supply schedules?
The types of supply schedules are: Linear supply schedule and Nonlinear supply schedule
4. How do you make a supply schedule?
The supply schedule is made by plotting the points of the supply curve and then connecting the points with a trend line. The trend line will show you the relationship between the price and quantity supplied in the market.
To make a supply schedule, you first need to collect data on the quantity that is supplied at different prices. The data can be collected from surveys or interviews with suppliers. The data can then be plotted on a Cartesian coordinate system, and a trend line can be drawn through the points.
5. What does the supply schedule show you?
The supply schedule shows you the quantity that is supplied at different prices in a market. This information can be used by producers and manufacturers to understand what products are required in the market and what price they need to charge.