
The correlation coefficient, also called the Pearson correlation, is a metric that reflects the relationship between two numbers. Numbers moving consistently at the same time have a positive correlation, resulting in a positive Correlation Coefficient. Meanwhile, those that move in opposite directions have a negative correlation, producing a negative correlation coefficient.
The correlation coefficient comes in handy when analyzing many different types of data but especially economic and finance. Although patterns usually go unmonitored by small businesses, larger entities such as investment banks and even the U.S. Federal Reserve use the Correlation Coefficient to help boost their understanding of market trends and make calculated predictions.
In a move to rouse the U.S. economy post-2008 financial crisis, the Federal Reserve reduced interest rates and ended up driving the country’s unemployment rate down. This proves that the Fed’s interest rate is positively correlated with the unemployment rate, or that both values have a positive Correlation Coefficient.
Correlation Coefficient Formula

- ρ = Pearson product-moment correlation coefficient
- Cov(x, y) = covariance of variables x and y
- σx = standard deviation of x
- σy = standard deviation of y
Manually calculating the correlation coefficient of two values can be tedious, especially when working with large data sets. There are, however, several tools that may be used to automate the process and save time.
Most commonly, you would use Excel to calculate the correlation coefficient.
A correlation coefficient of exactly 1 indicates a perfect positive relationship between two variables. That means for every positive increase in one variable, there is a corresponding positive increase in the other.
If the correlational coefficient between these two variables is -1.0, it means there is a perfect negative relationship between them, pointing out that the variables are moving in contrasting directions.
In such a scenario, a positive increase in one variable comes with a decrease in the other. A Correlational Coefficient of 0 between 2 variables proves their relationship is nonlinear.
The strength of the association between two variables can be quantified by the correlation coefficient. For instance, a value of 0.2 indicates a positive yet weak and likely negligible relationship. In certain fields, analysts only give importance to a correlation coefficient higher than 0.8. On the other hand, a value equal to or higher than 0.9, indicates a very strong relationship between the compared variables.
Correlation Coefficient Example
Investor Ethan’s portfolio mainly watches the performance of Tech A, a giant tech company, but he is considering adding the stock of another tech giant, Tech B. However, he wants to check the correlation between the two companies’ stocks to make sure that adding Tech B to his portfolio won’t raise his level of systematic risk.
To calculate the coefficient, Ethan researches the stock prices of each of the two companies over the last five-year period. Based on these values, what is the correlation coefficient between the two companies’ stock prices?
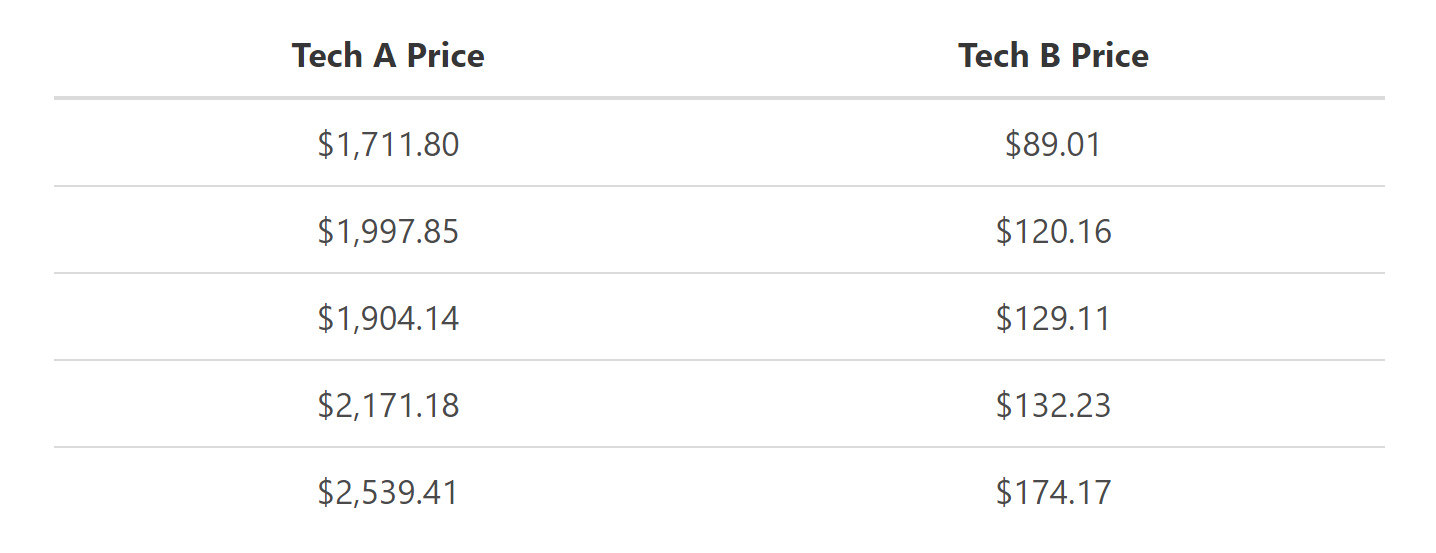
We’re not going to actually use the correlation coefficient formula because it is longer and more time consuming than is necessary. Instead, we’ll use a simple Excel spreadsheet which will calculate it for us.
Excel has a handy function, CORREL which will calculate the correlation for us:

The function is simple enough. In the first parameter, you highlight the x variables, and in the second, the y variables.
What this means is that there is a high correlation coefficient between the stock prices of Tech A and Tech B of 0.95.
The coefficient shows that the two tech companies’ stock prices are positively correlated. Because their prices move in a single direction, adding Tech B to Ethan’s portfolio would indeed raise his level of systematic risk.
Correlation Coefficient Analysis
Correlation coefficients can come in different types, but the most commonly used is known as the Pearson correlation (r). The correlation coefficient between two variables determines how strongly related they are, as well as which direction they are going. This metric does not work for nonlinear relationships between variables, however, nor can it tell dependent variables apart from independent variables.
Understanding how two variables affect each other is particularly useful to financial market investors. For instance, a correlation helps determine the performance of a mutual fund compared to its benchmark index or to another fund or asset. Diversification is beneficial when mutual funds added to the portfolio have low or negative correlation coefficient with that portfolio.
Thus, investors should add only negatively-correlated assets or securities to control market risk related to volatility or extreme price swings. A lot of investors hedge a portfolio’s price risk in order to minimize any capital gains or losses if they want their dividend income from the stock or security.
As well, correlation values enable investors to check the relationship between changes in two variables. For instance, bank stocks usually come with a very high positive correlation coefficient with interest rates, considering the central role market interest rates play in loan rate calculations. Should a bank’s stock price drop as interest rates go up, investors can detect that something’s misaligned.
If the stock prices of parallel banks in the same sector are also going up, investors can be sure that the decreasing bank stock is brought about not by interest rates but by internal issues possibly affecting the underperforming bank.
Correlation coefficients are generally useful but not without limitations. For example, they cannot be used to imply causation or make forecasts. While they reflect the relationship between two variables, no matter how strong, one variable does not necessarily cause or become a basis to predict the behavior of the other.
Correlation Coefficient Conclusion
- The correlation coefficient measures how strongly one variable is related to another variable.
- The correlation coefficient is one of the most popular values used in financial statistics.
- Correlation coefficient values range from -1, indicating an extremely negative relationship, to +1, showing an extremely strong positive relationship.
- Any Values below +0.8 or above –0.8 are considered unimportant.
- The correlation coefficient between two variables cannot be used to imply that one is the cause or predict the behavior of the other.
Correlation Coefficient Calculator
You can download the correlation coefficient calculator Excel spreadsheet below to quickly calculate the correlation coefficient between two values.
FAQs
1. What is the correlation coefficient?
The correlation coefficient is a measure of the strength and direction of a linear relationship between two variables.
2. How do you calculate the correlation coefficient?
The correlation coefficient is calculated using the Pearson product-moment correlation coefficient formula.
3. How is the correlation coefficient used in investing?
The correlation coefficient is used by investors to determine the performance of a mutual fund compared to its benchmark index or to another fund or asset. Diversification is beneficial when mutual funds added to the portfolio have a low or negative correlation coefficient with that portfolio.
4. What does a correlation coefficient tell you?
A correlation coefficient value tells you the strength and direction of the linear relationship between two variables. It does not imply that one variable cause or predicts the behavior of the other.
5. What are the types of correlation coefficients?
There are three types of correlation coefficients: Pearson, Spearman, and Kendall.