
Price earning to growth and dividend yield (PEGY) is a metric used in stock analysis that measures a stock’s potential for future earnings growth and dividend payments.
The price earning to growth and dividend yield is sometimes also called the dividend-adjusted PEG ratio. It was created as a way to improve the price to earnings ratio metric by Peter Lynch.
By including a stock’s future growth prospects and dividend yield into a stock analysis, the PEGY ratio allows investors to identify an undervalued stock.
The PEGY ratio allows all companies to be analyzed on an even playing field. A young new company most likely will not pay dividends but could experience a high and fast growth rate. A mature company, on the other hand, won’t experience as fast of a growth rate as the young company but could pay dividends. If you were to only use the price to earnings ratio then the mature company would be at a disadvantage.
When using the price earning to growth and dividend yield ratio to analyze a stock you want the resulting calculation to be below 1.0. A score of 1.0 or below means that the stock is currently selling at a great cost and that the stock has high growth potential or high dividend yields.
PEGY Formula

The price to earnings (P/E) ratio is calculated using the following formula:

The projected earnings growth rate is the percentage the company expects to grow its earnings over the coming year.
The dividend yield is calculated by dividing the dividend per share by the stock’s current price per share. It is important to remember that even though both the projected earnings growth rate and the dividend yield are both percentages they’re represented as whole numbers and not decimals in the PEGY formula (10% is 10, not 0.10).
PEGY Example
For this example let’s assume that you want to compare 3 stocks to determine which if any would be a good investment at their current price. Below is the breakdown of the three companies. Company 1 is a company that has been around for 7 years and is now starting to be considered a mature company.
Company 2 is new; they just became public a year ago and while they’re expecting high growth, they don’t pay any dividends. Company 3 is a fully mature company with slow but continual growth that pays dividends.
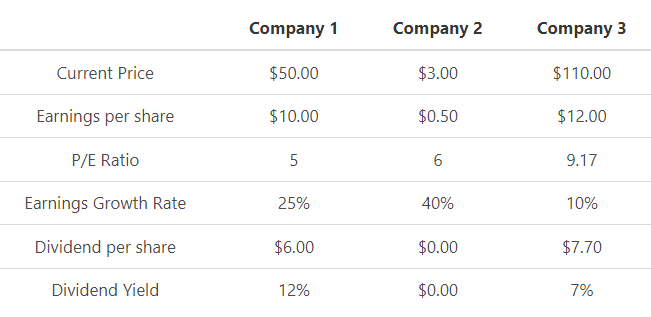
We can apply the values to our variables and calculate the price earning to growth and dividend yield for each company.


As you can see from the example, companies 1 and 3 have PEGY ratios below 1. That means that it might be a good idea to invest in them.
Even though it is young and expecting a 40% growth in earnings over the next year, business 2 has a PEGY ratio of 1.5. This means that it would not be the best investment at this time.
PEGY Analysis
Using the PEGY ratio to analyze stocks is a great way to ensure that each stock is being evaluated on equal terms. However, a disadvantage of the PEGY ratio is that it uses predicted growth so there is no way of guaranteeing that the ratio accurately reflects the stock’s future performance.
PEGY Conclusion
- The price earning to growth and dividend yield accounts for a stock’s potential for future earnings growth and dividend payments.
- It’s also referred to as the dividend-adjusted peg ratio and is an improvement to the price to earnings ratio.
- This formula requires 3 variables: price to earnings ratio (price / earnings per share), projected earnings growth rate, and dividend yield
- It levels the analysis playing field of both young and mature companies.
- Since it uses growth predictions and not historic growth data, there is no guaranteed accuracy of a company’s stock performance in the future.
- A score below 1.0 is an indication that the stock has high growth potential or high dividend yields and is currently selling at a great price.
PEGY Calculator
You can use the price earning to growth and dividend yield calculator below to quickly analyze the stock’s growth and dividend yield potential by entering the required numbers.
FAQs
What is price earnings to growth and dividend yield ratio (PEGY)?
The price earnings to growth and dividend yield ratio (PEGY) is a formula used to determine whether a stock has high growth potential or high dividend yields. The ratio is calculated by dividing the price to earnings ratio by the projected earnings growth rate, then multiplying that number by the dividend yield. A score below 1.0 is an indication that the stock has high growth potential or high dividend yields and is currently selling at a great price.
How is PEGY ratio calculated?
The PEGY ratio is calculated by dividing the price to earnings ratio by the projected earnings growth rate, then multiplying that number by the dividend yield.
What is a good PEGY ratio?
A good PEGY ratio is anything below 1.0. This indicates that the stock has high growth potential or high dividend yields and is currently selling at a great price.
Why should you use the PEGY ratio?
The PEGY ratio is a great way to ensure that each stock is being evaluated on equal terms. However, a disadvantage of the PEGY ratio is that it uses predicted growth so there is no way of guaranteeing that the ratio accurately reflects the stock’s future performance.
Why is price earnings to growth and dividend yield ratio important?
The price earnings to growth and dividend yield ratio is important because it evaluates a stock’s potential for future earnings growth and dividend payments. It also referred to as the dividend-adjusted peg ratio and is an improvement to the price to earnings ratio.