
Cost of capital in its simplest form is basically the rate of return that a firm must provide to its investors. It links the company’s short- and long-term financial decision since returns are tied with current costs.
Investments are generally made with the aim of generating profit. Very few investors would be willing to hand over capital if they didn’t expect a significant return. When a company raises capital, it has to offer something in return to its investors to cover their opportunity cost. This leads to the concept of cost of capital – each dollar raised by a company has a cost associated with it.
One of the most common practices of measuring the cost of capital is through the relationship between debt and equity when raising funds. This approach is regarded as the weighted average cost of capital (WACC).
Every company aims at generating profit to facilitate its bottom line and in many cases to provide return to its debt- and shareholders. Investment projects have to be able to cover the interest owed on any outstanding debt and also generate enough cash to pay dividends at the end of the quarter/year in order to keep shareholders interested in the stock long term. If the company manages to cover all of its operating expenses and has enough left to pay high dividends its stock price generally tends to increase as it projects more value. That’s why it’s important to calculate and weigh the cost of capital for its different components in order to have a debt and equity structure that is sustainable long term.
All investment opportunities that go successfully through the company’s capital budgeting process must have returns that are equal or greater than the company’s cost of capital. Otherwise, investments with lower returns would lead to accruing more debt and in extreme cases potentially the destruction of shareholders wealth.
Calculating WACC
The weighted average cost of capital takes into consideration the rate of return from each financing component and then weights it based on the percentage used for financing. The weights sum to a total of 1 which represents the capital structure of the company. The mathematical expression of WACC is expressed by the following equation.

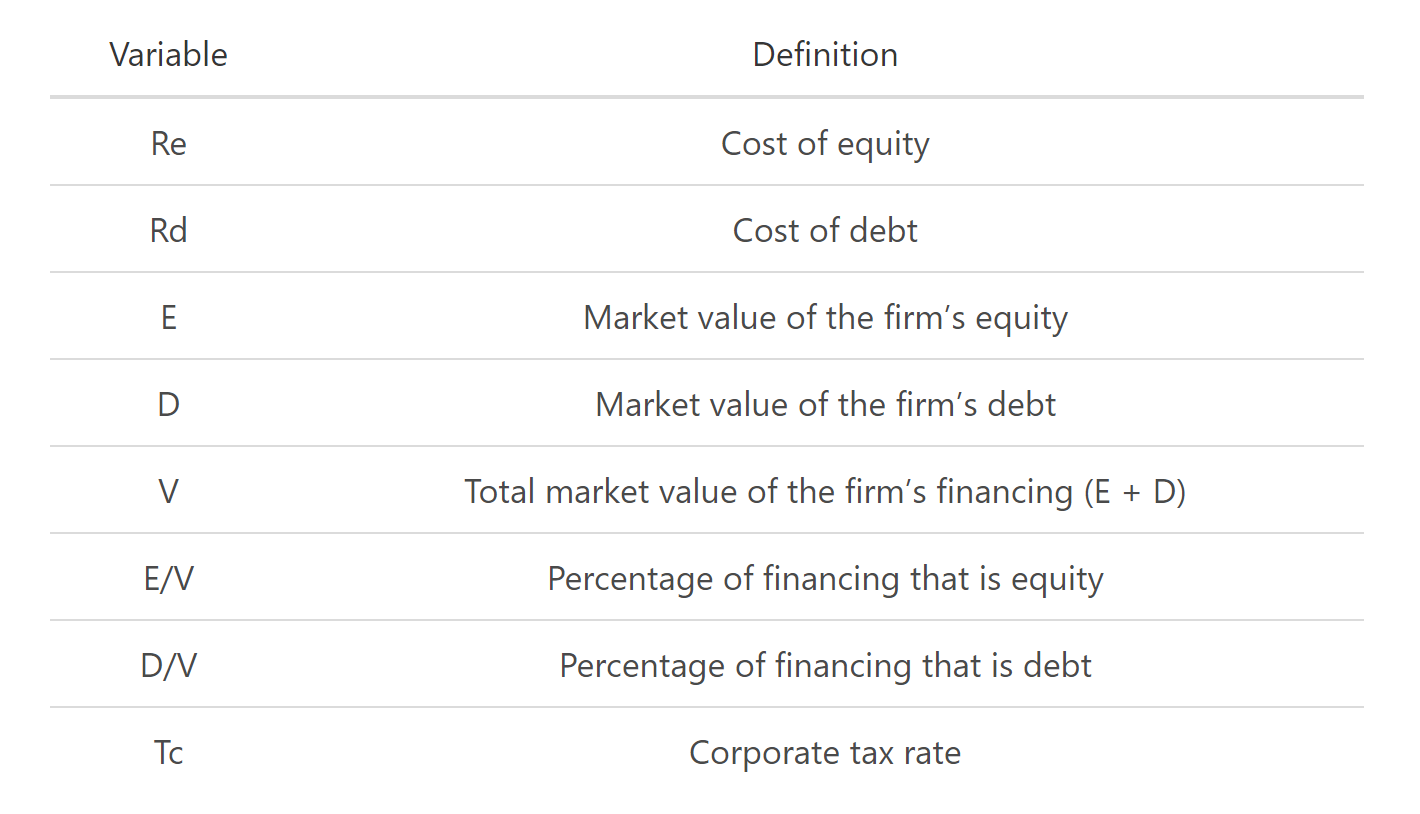
The following table will help you better understand what the components of the WACC formula are.
The WACC equation has 3 main parts that are all summed together:
- The after-tax cost of debt multiplied by the % of the debt that the company has
- The cost of preferred stock multiplied by the % of preferred stock
- The cost of common stock multiplied by the % of common stock
Generally, E/V and D/V refer to the relative percentage of debt, preferred stock, and common stock in the company’s capital structure, whereas Re and Rd are their associated cost. Rd is the only component multiplied by (1 – Tc), where Tc refers to the tax rate because the interest expense can be used as a deduction which leads to savings when accounting for tax.
Tip: We have a WACC calculator you can use to quickly work out the cost of capital.
Breaking down the cost of capital components
Calculating a company’s cost of capital can be done in a number of ways. For example, if its debt is publicly traded and market prices are available, the yield to maturity can be taken as the cost of capital. It’s entirely possible, however, for this information to not be readily available.
Another approach is based on benchmarking the cost of capital to similar companies. Averaging the available cost of capital of companies within the same bond rating and industry will give you a precise rate to plug into the formula.
If there’s no market price or bond rating available for the company’s debt, its rating can be calculated based on the following financial ratios.
The cost of preferred stock is calculated through the ratio of dividends per preferred stock and its current price:

The cost of common stock can be calculated either through the capital asset pricing model or the dividend discount model.
Under the capital asset pricing model, the cost of common stock (or in many cases cost of equity) is calculated through the relationship between the market risk-free rate, the company’s beta and the market risk premium (also known as equity risk premium):

- ERi = Expected return of investment
- Rf = Risk-free rate
- Bi = Beta of the investment
- (ERm – Rf) = Market risk premium
The risk-free rate of return is the theoretical rate of return of an investment with zero risk. This rate represents the return/interest that an investor would expect from a risk-free investment. A good benchmark for it is the 10-year U.S. government bond rate and is often taken as the risk-free part in the equation.
Beta measures the stock’s volatility – the relation between the stock and the market and how its price fluctuates under the pressure of market trends and interest rates. β represent the stock’s risk compared to that of the market and other stocks.
Тhe market risk premium (also called equity risk premium) represents the difference between the expected return on an investment in an equity market portfolio (such as the S&P 500) and the risk-free rate of treasury bond yields.
The historical risk premium approach is also worth mentioning in case there isn’t a reliable way to estimate the market risk premium. This approach averages the historical market risk premium for the last 5, 10 or 20 years. The historical market risk premium generally varies by up to 2% since investors differ in their investing styles, different risk tolerance and analytical approach.
Circling back to the dividend discount model (DDM), it values a company’s stock price based on the approach that its stock is basically worth the sum of all future dividends, discounted back to the present. It’s mainly applicable for newly listed companies and in its simplest form, the model is broken down to the logic that a stock’s total return equals the sum of its income and capital gains through the following formula:

D is the dividend per share expected in the first year and P is the current market price of the stock with g being the sustainable growth rate. This model is highly influenced by the growth rate chosen/calculated which often leads to high variance in its application.
Cost of capital example
Let’s calculate the WACC for Walmart Inc. (WMT) for 2018. As of October 2018, the following data is available:
- The risk-free rate, represented by the annual return on 10Y Government bonds, is 2.7%
- Walmart’s adjusted beta calculated at 0.37.
- The average market return, based on S&P 500 index, – 9.8%
- Walmart’s effective tax rate – 30%
- Market capitalization (equity value) – $276.7 billion
- Based on WMT’s balance sheet:
- Interest expense – $2.33 billion.
- Long term debt – $50 billion.
- Total capital ($276.7 billion + $50 billion) is equal to $326.7 billion
- The company has no preferred stock
To find the cost of common stock we’ll use the capital asset pricing model (CAPM). The 10Y Government bonds can be used as the risk-free rate and the expected market return is taken from S&P 500.
Walmart’s cost of equity equates to 2.7% + 0.37 * (9.8% – 2.7%), or 5.32%.
Since there’s no preferred stock, after calculating the cost of equity, all that’s missing is the cost of debt. It’s calculated by dividing the WMT’s interest expense by its debt. The 2018 interest expense is $2.33 billion which when divided by the total debt of $50 billion equals a total of 4.66% cost of debt.
WMT’s tax rate can be calculated by dividing its income tax expense by income before taxes which can be found in its annual report and is approximately 30%. The company’s capital structure is 15% debt ($50 / ($50+$276.7)) and 85% equity (($276.7 / ($50+$276.7))
Finally, we’re ready to plug in the numbers and calculate. The calculation ends up being:

In conclusion, Walmart would have to effectively pay on average 5.01% if it decides to raise new capital which is also the rate that potential new investments by the company have to cover in order for them to be favorable and profitable.
Cost of capital articles
- Asset Purchase Agreement
Asset purchase refers to the process involved in the buying of a company’s assets.
- Net Asset Value
Net asset value (NAV) refers to the net worth of a firm and is calculated as the difference between the total assets and total liabilities of the firm.
FAQs
1. What is a cost of capital?
The cost of capital is the rate that an investment must earn in order for it to be profitable. It can also be referred to as a minimum required rate of return.
2. How do you calculate the cost of capital?
To calculate the cost of capital/minimum required rate of return, you calculate a company’s WACC. To do that, a company must first find its cost of equity and cost of debt using CAPM.
After finding the two numbers, they are combined with weights from a company’s capital structure to get the final cost of capital.
3. What is the difference between the cost of capital and the discount rate?
The cost of capital/minimum rate of return is based on a firm’s future cash flows, while the discount rate reflects the effect inflation will have on those cash flows.
Another difference is that the discount rate is used for capital budgeting while the cost of capital is used for evaluating potential investments.
4. What are the types of cost of capital?
There are two types of cost of capital – the corporate cost of capital and the personal cost of capital.
The corporate cost of capital is used for evaluating potential projects by a firm while the personal cost of capital is utilized for determining how much an individual should save in order to meet their specific financial goals.
5. Why is the cost of capital important?
The cost of capital is important because it tells how much investment must earn in order for it to be profitable. It also provides a benchmark for the different expected rates of return.
For example, a company’s WACC will be used as a reference to find out if a potential project is profitable or not.