
The cash to current liabilities ratio, also known as the cash ratio, is a cash flow measure that compares the firm’s most liquid assets to its short-term obligations. This ratio allows an investor or analyst to understand the ability of a company to meet its short-term liabilities (current liabilities) using its most liquid current assets (cash and cash equivalents and marketable securities).
Although it may vary depending on the type of business, current liabilities of a company include accounts payable, short-term debts and current portion of the long-term debt, deferred revenues, and accrued expenses.
Through this ratio, investors and analysts are able to understand if the company is capable of generating enough cash flow from its operations to sustain the company in a stable and sound financial position in the long run. This ratio is more realistic if measured over time as it may reveal a long-term pattern that might be hidden in the short-term or in a single analysis.
Generally speaking, a high or increasing cash to current liabilities ratio implies that the company is not struggling to pay off its short-term debts and vice versa. This ratio makes more sense if it is benchmarked against its peer companies in the industry, and usually, a higher ratio is preferred.
Cash to Current Liabilities Formula

Cash and cash equivalents are those most liquid assets of a company that can be converted into cash within three months or less whereas, marketable securities are those temporary investments of a company that can be converted into cash in less than three months, so, any short-term investment which takes more than three months should not be included.
In the denominator of the formula, we sum up all the current liabilities of the company mentioned in the introduction. All this information required in calculating the cash to current liabilities ratio can be found in the company’s balance sheet.
Cash to Current Liabilities Example
After being ranked as the best company twice in a row by creditors, the management of XYZ Company Limited decided to find out why. The Company’s Credit and Finance Officer extracted the information below from its balance sheet over the last three quarters to assess the company’s cash to current liabilities ratio.
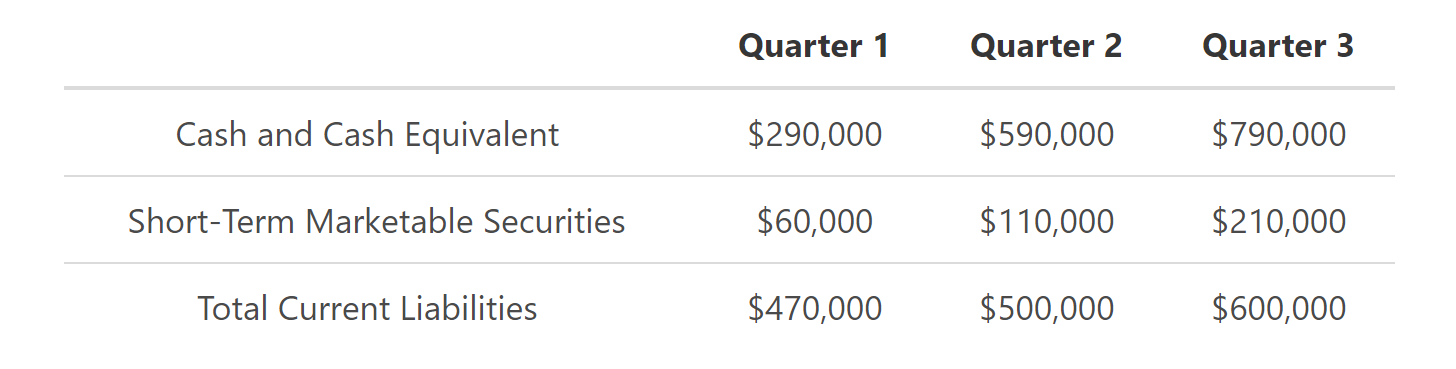
Quarter 1
Now let’s break it down and identify the values of different variables in the problem.
- Cash and cash equivalents = $290,000.
- Short-term marketable securities = $60,000.
- Total current liabilities = $470,000.

For quarter 1, the cash to current liabilities ratio is 0.745.
Quarter 2
Now let’s identify the values of quarter 2 variables in the problem.
- Cash and cash equivalents = $590,000.
- Short-term marketable securities = $110,000.
- Total current liabilities = $500,000.

For quarter 2, the cash to current liabilities ratio is 1.40.
Quarter 3
Now let’s identify the values of quarter 3 variables in the problem.
- Cash and cash equivalents = $790,000.
- Short-term marketable securities = $210,000.
- Total current liabilities = $600,000.

For quarter 3, the cash to current liabilities ratio is 1.67.
The cash to current liabilities ratio tells us the ability of the company to cover its total current liabilities using its cash and cash equivalents balance. The results above revealed that in the last two quarters the company was capable of paying off all its current liabilities using its current cash and cash equivalents balance and even remaining with some balance to reinvest back into the business.
The fact that creditors’ accounts could be cleared comfortably made the rank of the company to be their best. In the first quarter, the company was only capable of paying off only 74.5% of its current liabilities using its most liquid current assets.
Cash to Current Liabilities Analysis
The cash to current liabilities ratio, also known as the cash ratio, is a measure of cash flow within the company. It allows the investor-analyst to understand if the company is capable of generating enough cash flow from its ongoing operations to pay off its short-term liabilities. This ratio reveals what percentage of the company’s current liabilities can be covered by its most liquid asset instruments.
This ratio to some extent measures the creditworthiness of a company, for example, a ratio above 1.0 is an indicator of efficient cash flow in the company implying that all the current liabilities can be comfortably be covered by the company’s most liquid assets.
Users of this ratio need to be well conversant with the current liabilities and most liquid current assets of a company, as discussed in the introduction section so that they only pick the right variables from the balance sheet, for example, in the numerator of the formula, short-term investments which take more than three months to mature should be excluded.
Generally speaking, a high cash to current liabilities ratio is always preferred by creditors as it indicates the high creditworthiness of a company. When the ratio is more than 1.0, it implies that the cash and cash equivalents are more than the company’s accounts payable hence can comfortably cover all its debts and remain with a cash balance that can be reinvested back into the business to expand the growth of the business. A low ratio means that the amount of cash and cash equivalents of a company cannot sufficiently pay its creditors hence viewed to be having low creditworthy.
To gain a realistic image of how the company is performing, the cash to current liabilities ratio should compare against companies operating in the same industry. As a suggestion, a more realistic, this ratio should be measured over time to assess a long-term pattern that can be hidden in the short-term. Finally, when computing this ratio for firms with a relatively high cost of labour, the investor analyst should understand if payroll expenses are included in current liabilities.
Cash to Current Liabilities Conclusion
- The cash to current liabilities ratio is a cash flow measure used by investor-analyst to understand if the company is capable of generating enough cash flow from its ongoing operations to pay off its short-term liabilities
- This ratio reveals what percentage of the company’s current liabilities can be covered by its most liquid asset instruments.
- A high ratio implies that the company’s most liquid current assets can cover its current liabilities without struggling hence showing an indicator of the high creditworthiness of the company.
- A low ratio implies that the company’s most liquid assets are not sufficient enough to cover its total liabilities and hence relies on other forms of current assets like accounts receivable to pay off its debts.
- The cash to current liabilities ratio looks at the company’s most liquid assets (cash and cash equivalents and marketable securities), and their current liabilities.
Cash to Current Liabilities Calculator
You can use the cash to current liabilities ratio calculator below to quickly calculate what percentage of the company’s current liabilities can be covered by its most liquid assets (cash and cash equivalents and short-term marketable securities) by investing one dollar of fixed assets by entering the required numbers.
FAQs
1. What is cash to current liabilities ratio?
The cash to current liabilities ratio is a measure of cash flow within the company. It allows the investor-analyst to understand if the company can generate enough cash flow from its ongoing operations to pay off its short-term liabilities.
2. What is the formula for cash to current liabilities ratio?
The formula for the cash to current liabilities ratio is:
Cash to Current Liabilities = Cash+Cash Equivalents+Marketable Securities / Total Current Liabilities
3. What is a good cash to current liabilities ratio?
A good cash to current liabilities ratio is one that is between 0.5 and 1.0. This implies that the company’s most liquid assets can cover its current liabilities without struggling.
Anything above 1 show that the company is in a good position to cover its current liabilities, and anything below 0.5 suggests that the company may have liquidity issues.
4. How do you interpret cash to current liabilities ratio?
In general, a high cash to current liabilities ratio is always preferred by creditors as it indicates the high creditworthiness of a company. When the ratio is more than 1.0, it implies that the cash and cash equivalents are more than the company’s accounts payable hence can comfortably cover all its debts and remain with a cash balance that can be reinvested back into the business to expand the growth of the business.
A low ratio means that the amount of cash and cash equivalents of a company cannot sufficiently pay its creditors hence viewed to be having low creditworthy.
5. Is it good to maintain a high cash ratio?
There is no definitive answer to this question. A high cash ratio is good for a company in the sense that it demonstrates that the company is capable of covering its liabilities and has enough cash on hand to reinvest in the business.
However, if a company keeps too much cash on hand, it may be foregoing opportunities to make more money by investing in new ventures or products. In this case, it is up to the company's management to decide if having a high cash ratio is more important than investing in new opportunities.